

Ekahau heatmaps address this problem by introducing a structured, data-driven approach to wireless design. Instead of relying on estimations, they provide a visual and analytical representation of how radio frequency signals will propagate throughout a given space before any hardware is installed. By incorporating factors such as building materials, layout complexity, interference sources, and access point characteristics, Ekahau enables precise modeling of real-world conditions.
This level of visibility allows network designers to identify potential coverage gaps, interference zones, and performance limitations at an early stage. As a result, adjustments can be made proactively rather than reactively. Access point placement can be optimized, capacity requirements can be validated, and overall network performance can be aligned with business needs before deployment begins.
The outcome is a more predictable and efficient implementation process. Organizations can reduce costly rework, avoid post-installation troubleshooting, and ensure that the network delivers consistent performance from the first day of operation.
1. What Is an Ekahau Heatmap?

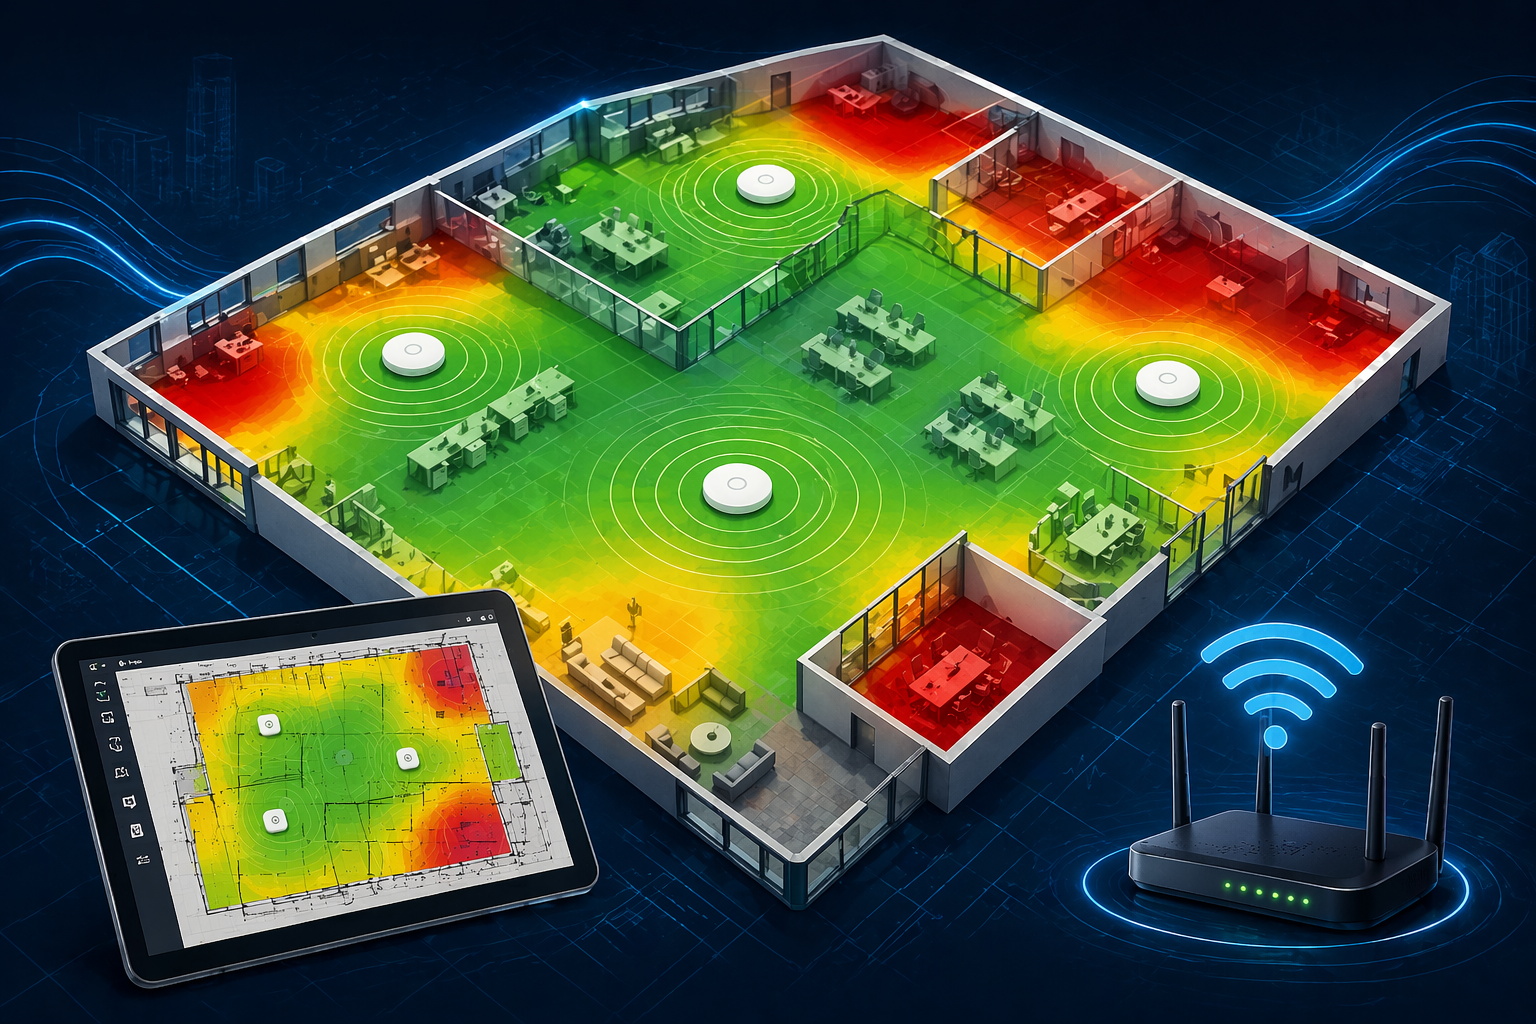
An Ekahau heatmap is a visual representation of wireless signal coverage across a physical environment, created using either predictive modeling or real-world survey data. It translates complex radio frequency behavior into an intuitive, easy-to-understand format that allows engineers, designers, and stakeholders to quickly assess network performance across an entire space.
At its core, the heatmap uses color gradients to represent signal strength and quality:
-
Green indicates strong, reliable signal coverage suitable for high-performance connectivity
-
Yellow represents moderate signal levels where performance may be acceptable but not optimal
- Red highlights weak signal areas or complete coverage gaps, commonly referred to as dead zones
This visual approach simplifies what would otherwise be a highly technical analysis, enabling faster decision-making and clearer communication between technical and non-technical teams.
Behind this simplified visualization lies a sophisticated RF simulation engine. Ekahau does not rely on generic assumptions. Instead, it models how wireless signals behave in a specific environment by incorporating multiple real-world variables, including:
-
Building materials such as concrete, drywall, glass, and metal, each of which impacts signal attenuation differently
-
Access point models and antenna patterns, ensuring that coverage reflects the actual hardware being deployed
-
Frequency bands, including 2.4 GHz, 5 GHz, and 6 GHz, each with distinct propagation characteristics and performance profiles
-
Environmental interference, such as neighboring networks, electronic devices, and structural obstructions that affect signal quality
By accounting for these factors, Ekahau provides a highly accurate prediction of how a wireless network will perform before installation, or a precise measurement of how it is performing in a live environment.
This transforms wireless design from a trial-and-error process into a structured, data-driven discipline. Network designers are no longer forced to rely on assumptions or generalized best practices. Instead, they can make informed decisions based on measurable insights, ensuring that coverage, capacity, and performance requirements are met with confidence.
2. Why Dead Zones Happen?
A Wi-Fi dead zone is an area within a physical environment where wireless signal strength is too weak to support reliable connectivity, or where no signal is available at all. In these areas, users may experience slow speeds, frequent disconnections, or complete inability to access the network. Dead zones are not random occurrences. They are the result of how radio frequency signals interact with the environment and how the network is designed.
Dead zones typically originate during the planning and design phase rather than after deployment. They are most often caused by incomplete data, incorrect assumptions about the environment, or improper access point strategy. Without a structured approach to wireless design, these issues become embedded into the network from the start.
Common causes include:
-
Physical obstructions such as thick walls, concrete, metal structures, or glass, which attenuate or block wireless signals and prevent them from reaching certain areas
-
Incorrect placement of access points, where APs are positioned without considering coverage patterns, leading to uneven signal distribution
-
Improper AP density, including too few access points resulting in coverage gaps, or too many access points causing overlap, interference, and degraded performance
-
Signal interference from other electronic devices, neighboring networks, or environmental noise that disrupts signal quality
-
Lack of a proper site survey, meaning the network is deployed without validating real-world conditions, leading to inaccurate coverage assumptions
When these factors are not identified and addressed early, they manifest as performance issues in the live environment. Users experience slow data speeds, unstable connections, dropped sessions, and inconsistent coverage. Over time, this leads to reduced productivity, increased support overhead, and a poor overall user experience.
Dead zones are therefore not just a technical issue. They are a direct consequence of insufficient planning and lack of data-driven design.

3. How Ekahau Heatmaps Solve This Problem
Ekahau heatmaps enable a structured and data-driven approach to wireless network design by identifying potential issues before deployment. Instead of reacting to performance problems after installation, organizations can proactively design networks that meet coverage, capacity, and performance requirements from the outset.
1. Plan Wi-Fi Before Installation
Ekahau uses predictive survey capabilities to simulate how wireless signals will behave within a specific environment. By incorporating floor plans, building materials, and access point specifications, it creates an accurate model of expected coverage and performance. This allows designers to evaluate signal strength, coverage consistency, and potential interference zones before any hardware is installed. As a result, decisions are made based on validated data rather than assumptions, significantly reducing deployment risk.
2. Identify Dead Zones in Advance
Heatmaps provide immediate visibility into weak coverage areas and potential dead zones. These areas are clearly highlighted, allowing designers to address gaps early in the planning phase. Adjustments to access point placement, power levels, or density can be made iteratively until the entire space meets the desired coverage thresholds. This eliminates the need for costly post-installation corrections.
3. Optimize Access Point Placement
Effective wireless performance depends heavily on precise access point placement. Ekahau enables designers to determine optimal AP locations based on real signal propagation rather than arbitrary positioning. It provides clear guidance on:
- Where access points should be installed for maximum coverage
- The number of access points required to meet capacity and performance goals
- Target signal levels needed to support specific applications and user density
This ensures a balanced design that avoids both under-coverage and excessive overlap, which can lead to interference.
4. Improve Speed and User Experience
Coverage alone does not guarantee a high-quality network. Performance must also be considered. Ekahau heatmaps help maintain strong signal strength and consistent performance across the environment by ensuring proper signal levels and minimizing interference. This contributes to:
- Higher throughput and data rates
- Stable and reliable connectivity
- Seamless roaming between access points without dropped connections
The result is a network that supports both user expectations and application requirements.
Where Ekahau Heatmaps Are Most Effective
Ekahau is particularly valuable in environments where wireless performance is critical and layouts are complex. These include:
- Corporate offices and enterprise environments with high user density
- Hospitals and healthcare facilities where reliability is essential
- Warehouses and logistics centers with large open spaces and obstructions
- Educational institutions with varied building structures and usage patterns
- Retail stores and shopping centers with dynamic user behavior and interference sources
In such environments, the combination of structural complexity and performance demands makes predictive visualization essential.
For optimal results, predictive heatmaps should be validated with real-world survey techniques. While modeling provides a strong baseline, on-site validation ensures accuracy under actual operating conditions. Common approaches include:
- Onsite Wi-Fi RF Surveys to capture real signal behavior within the environment
- Active Surveys to measure real performance metrics such as throughput and connectivity stability
-
AP-on-a-Stick Surveys to simulate access point placement before final installation
Combining predictive modeling with empirical validation ensures that the network performs as expected both in theory and in practice.
6. Conclusion
Wi-Fi dead zones are not the result of unavoidable technical limitations. They are typically the outcome of insufficient planning and lack of data-driven design. Ekahau heatmaps provide the visibility and analytical foundation required to design wireless networks with precision.By identifying issues early, optimizing access point placement, and validating performance before deployment, organizations can avoid costly rework and deliver a network that meets performance expectations from day one. This proactive approach leads to improved reliability, better user experience, and more efficient use of resources.
For organizations that depend on wireless connectivity, a structured and data-driven design approach is critical. With the right planning methodology and tools in place, dead zones can be identified and eliminated before they ever impact users.
At Orion, we focus on designing and validating wireless networks with precision, ensuring reliable coverage, consistent performance, and long-term scalability. If you are looking to reduce Wi-Fi dead zones and deploy a network that performs as expected from day one, connect with Orion to get it done right.
Please get in touch with the experts at Orion US today.

Image Source: Canva